projects
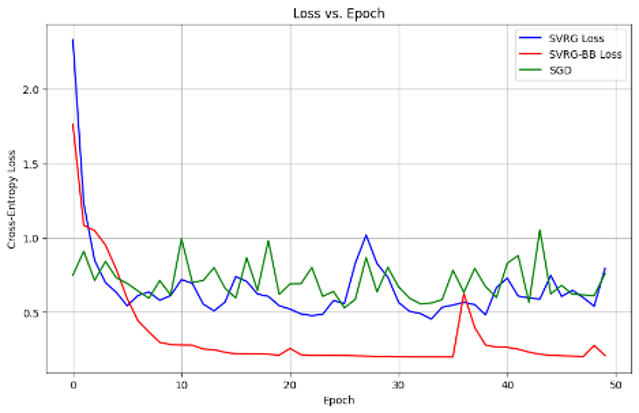
Barzilai-Borwein Step Size for Stochastic Gradient Descent
Implemented research paper - Barzilai-Borwein Step Size for Stochastic Gradient Descent algorithm as part of computational methods course.

Forecasting Electricity Price using Autoregressive and LSTM Model
Developed and optimized PyTorch LSTM model for forecasting Location Marginal Price and compared with autoregressive models. Implemented feature engineering and time-series analysis. LSTM model outperformed traditional statistical methods, achieving a MAE of 3.92 and RMSE of 9.21—outperforming the benchmark SARIMAX model (MAE=4.05, RMSE=9.87).
Power Consumption Analysis and Prediction
Capstone project for data analytics course applying learned methodologies to energy consumption analysis. Practiced end-to-end analytics workflow- data wrangling, exploratory analysis, visualization, and predictive modeling. Key deliverables included clustering analysis of daily load patterns, regression modeling, and feature importance analysis for thermal comfort. The project demonstrated application of course concepts including data preprocessing, statistical analysis, machine learning implementation, and result interpretation in a practical domain.

Home Credit Default Risk
This course project, developed for the Data Mining II course in the Industrial and Systems Engineering (ISE) program, focuses on predicting loan default risk using real‑world financial and demographic data from the Home Credit dataset. The objective was to build reliable machine learning models like XGboost and LightGBM that identify high‑risk applicants while minimizing false rejections, enabling data‑driven credit decision‑making.
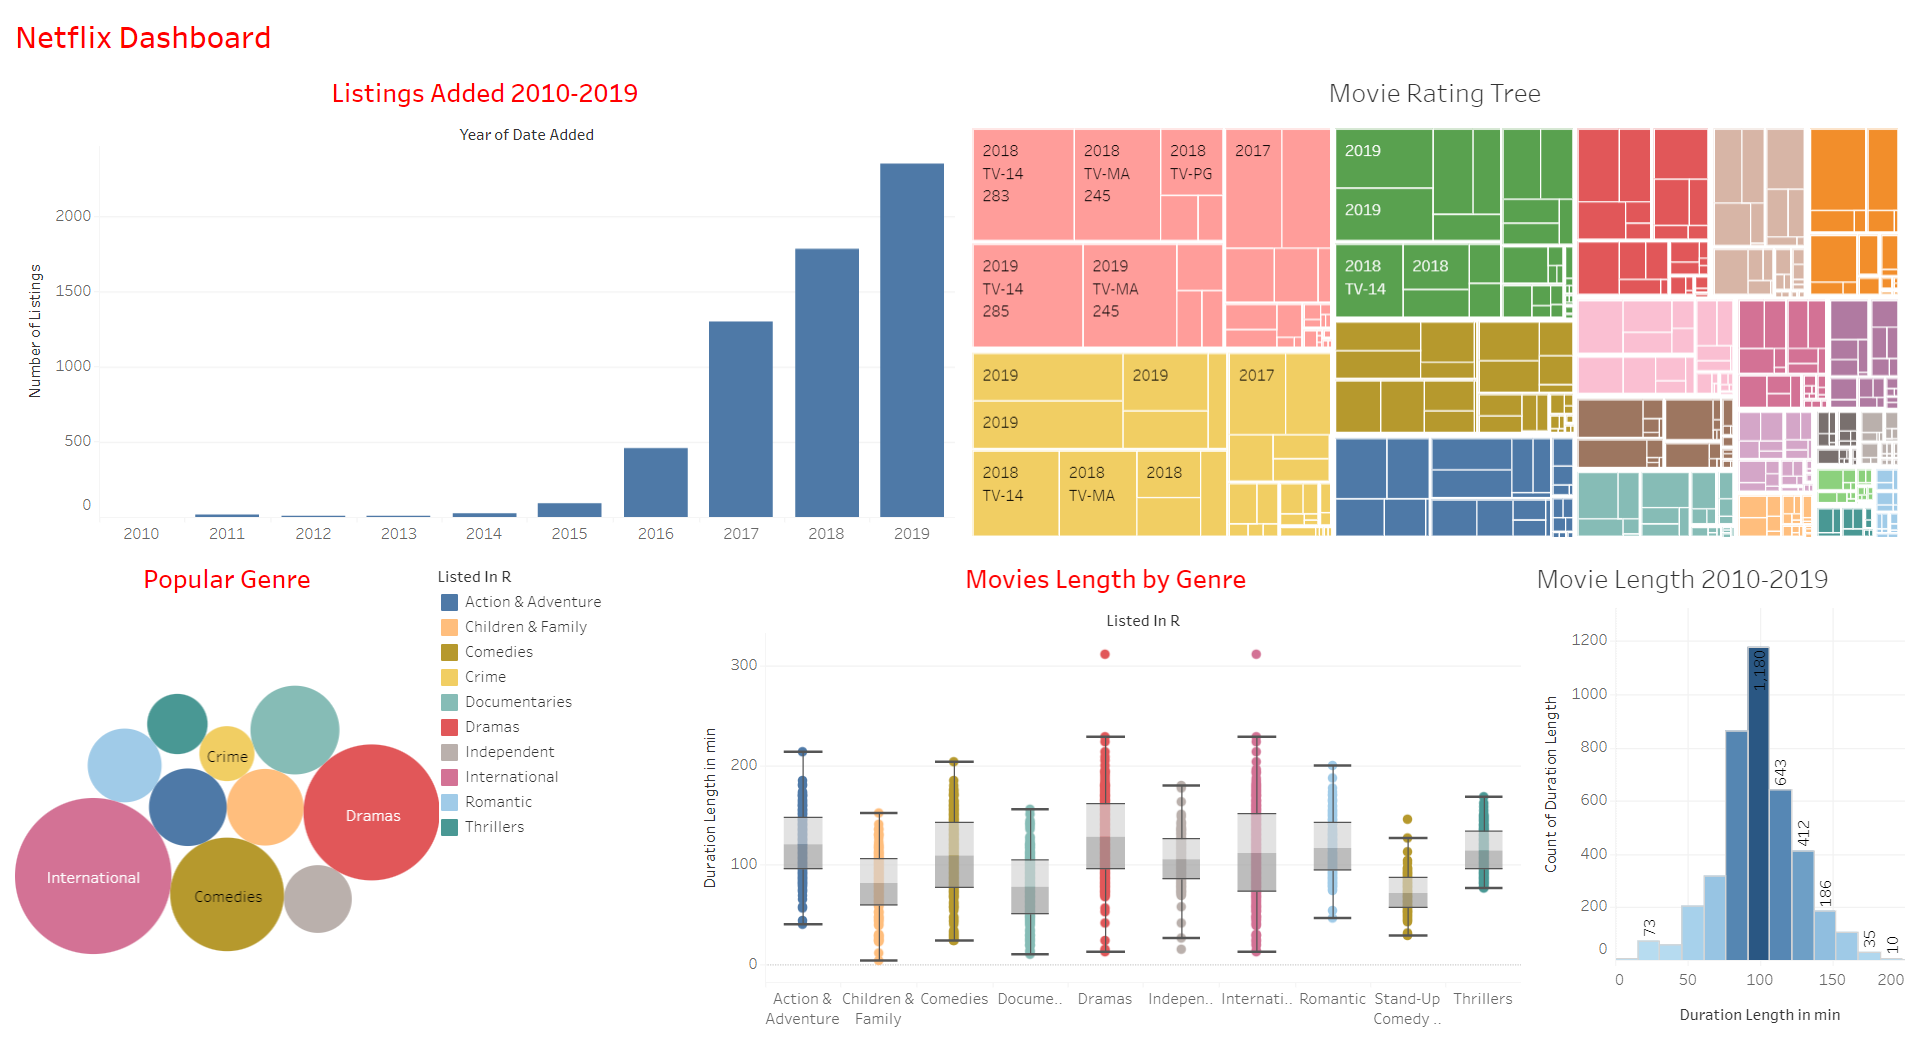
Tableau Data Visualization
Applied Tableau learning through creation of multiple business intelligence dashboards. Primary sales dashboard analyzes $21M+ in revenue with features including customer segmentation, monthly profit trends, demographic breakdowns by age/wealth, industry analysis, and top product performance. Supplemental dashboards cover Netflix content trends and geographical sales distribution. This project-based approach helped master data visualization principles, dashboard design, and interactive analytics while building portfolio pieces that demonstrate practical Tableau skills for business intelligence applications

Pattern Analysis of 9 years of US Vehicle Accidents
Pattern analysis of 9 years of US vehicle accident data (2.8M records) investigating environmental factors impact on traffic behavior. Conducted extensive EDA using R and ggplot2, performed text mining on accident descriptions, and developed interactive visualizations in Tableau. Built a Streamlit web app for data exploration, identifying key patterns including rush hour peaks, fair weather accidents, and high-risk locations to propose data-driven road safety policies